You will be familiar with the product market matrix if you’ve ever decided to build or buy a particular product. This should give you confidence and inspiration that your product will have a decent market.
Product Market Matrix?
It is one of the most famous marketing tools for evaluating a product’s existing and potential markets to identify possible opportunities, threats, and key strategies. It comes from Michael Porter’s five forces model, often used to assess a company’s position within its industry.
But nowadays, businesses use this model to also analyze all the opportunities outside their industry.
The main question is, does it help businesses? Let’s dive deep to learn everything about the product market matrix!
Product Market Matrix: An Overview!
A product market matrix is a strategic tool that helps product teams find out the strengths, opportunities, weaknesses, and threats of the products and services. Companies use this matrix to identify their marketplaces and target customers.
A product market matrix is a tool that marketing managers use to understand the product they will launch in the market. It helps them to identify their target market and also helps them understand their competitors.
It has various models, but we are discussing two of the most prominent ones: BCG & Ansoff.
The BCG Product Market Growth Matrix
This matrix assists companies in understanding their current state while planning for future competitive landscapes. It basically helps businesses to determine the current status of their products to determine whether they are investable or not.
It has four quadrants divided on the basis of market share and growth. Before discussing these four quadrants, you should know that it can only serve as a starting point for analyzation of product success and failure. BCG only reveals market share and growth and tells about the success and failure of the product but doesn’t speak of the reason behind such changes.
→ Related content: BCG Growth–Share Matrix
Now, let’s discuss the four quadrants of the BCG product growth matrix;
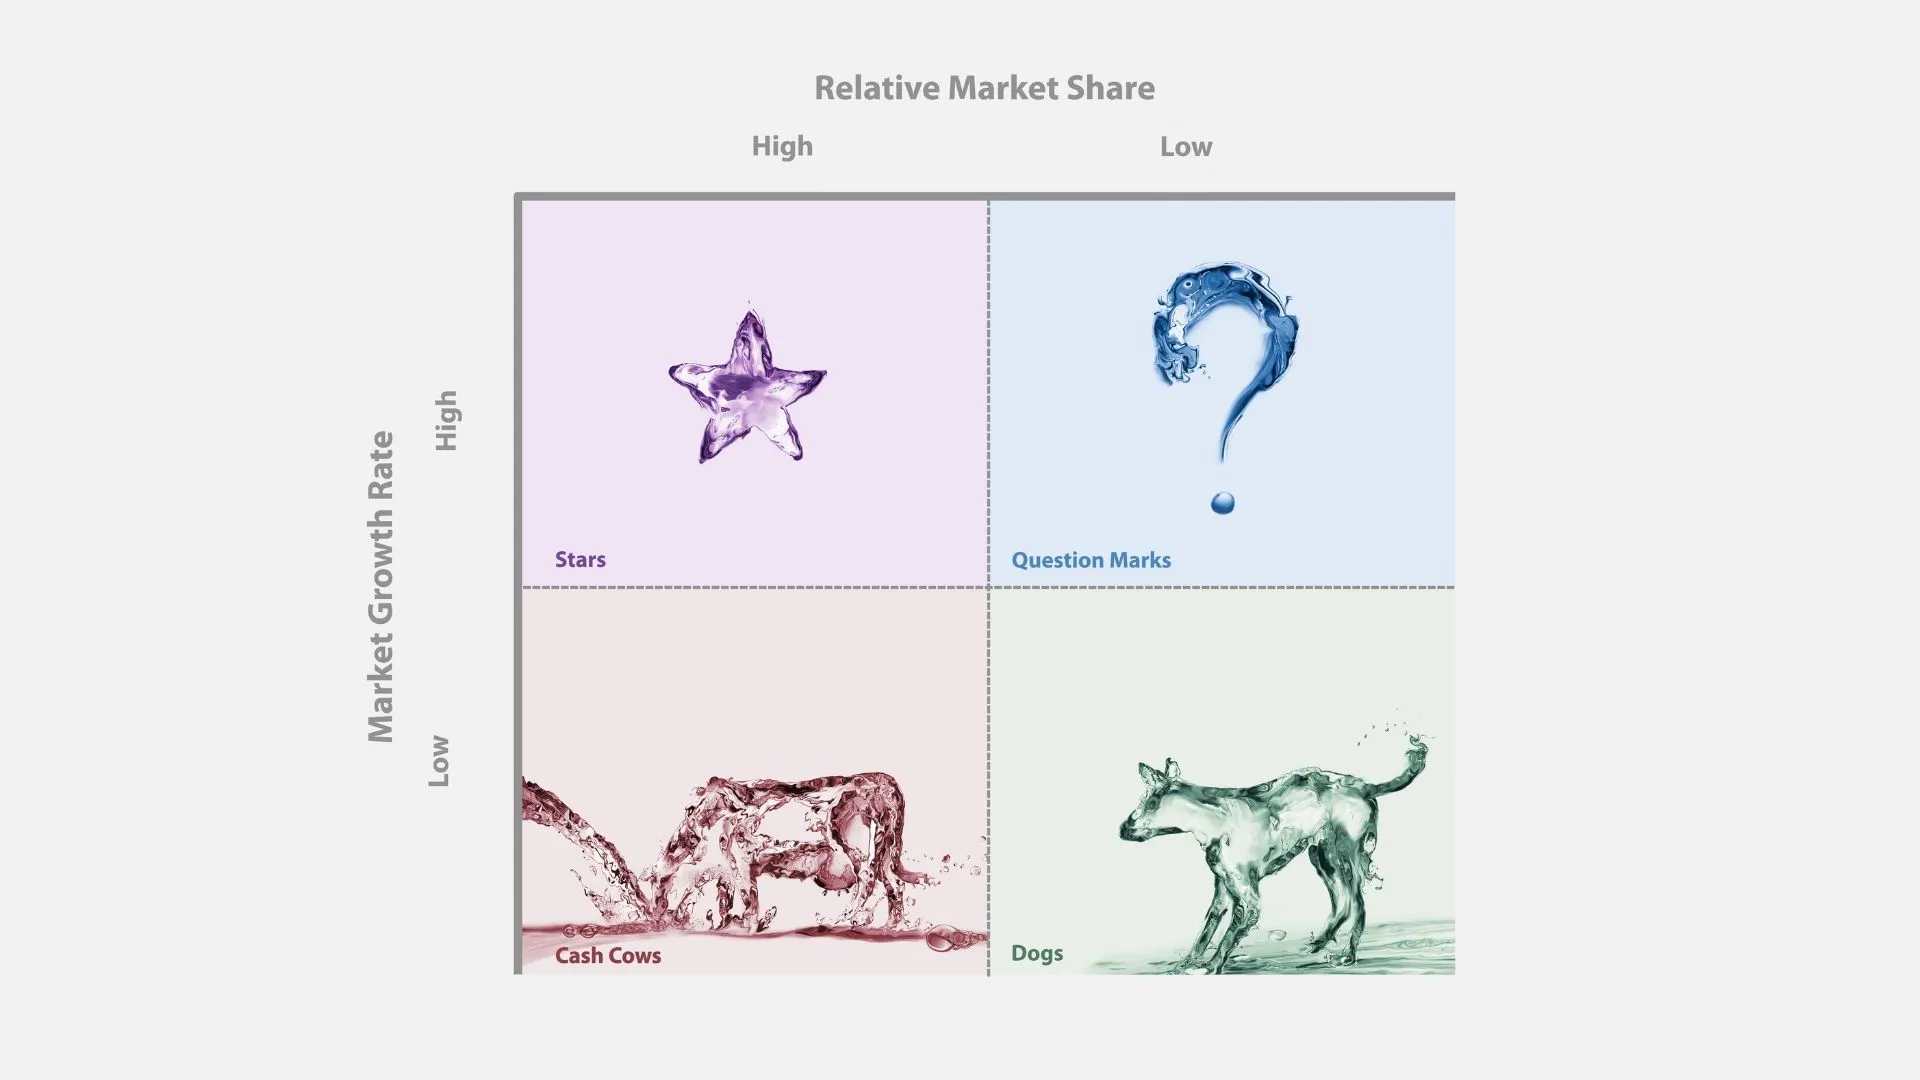
Cash Cows: Low Growth, High Share
As the name suggests, cash cows are generally products or brands that generate more cash than they require. These usually occupy top spots in the market. These have lower growth but higher market shares. Cash cows supply funds to run other parts of businesses. These usually help products in the Question mark quadrant to become market leaders.
Stars: High Growth, High Share
Stars having high market shares generate a considerable amount of revenue. But being in a highly competitive space, stars need a lot of investment to grow. Unlike cash cows, these don’t generate any significant surplus. So, there’s no investable cash for other parts of businesses or other quadrants of the matrix.
Generally, these potentially high-growth products are likely to become cash cows of the future.
Question Marks: High Growth, Low Share
In this competitive position, businesses find themselves circled by opposing opinions. As the product has high growth but has low shares that’s why requires a lot of investment. Some businesses find it riskier to invest in this quadrant as success isn’t guaranteed here. If it fails, the product is likely to end in the dog quadrant. Otherwise, a cash cow’s investment is spent here, these are likely to become market leaders in the upcoming months or years.
Due to its confusing nature, researchers usually call it a problem child.
Dog: Low Growth, Low Share
Products in this category have low growth potential and market share. These products may only become profitable because they’re too similar to other offerings on the market or because there needs to be more demand for them (yet). Businesses usually don’t prefer this quadrant as it reserves their cash without any future growth potential. That’s why some people call ‘dogs’ cash traps.
Ansoff Product Market Growth Matrix
Ansoff bisected it into two approaches: Market growth (who is sold to) & Product growth (what is being sold). A product strategy matrix can be classified into four types:
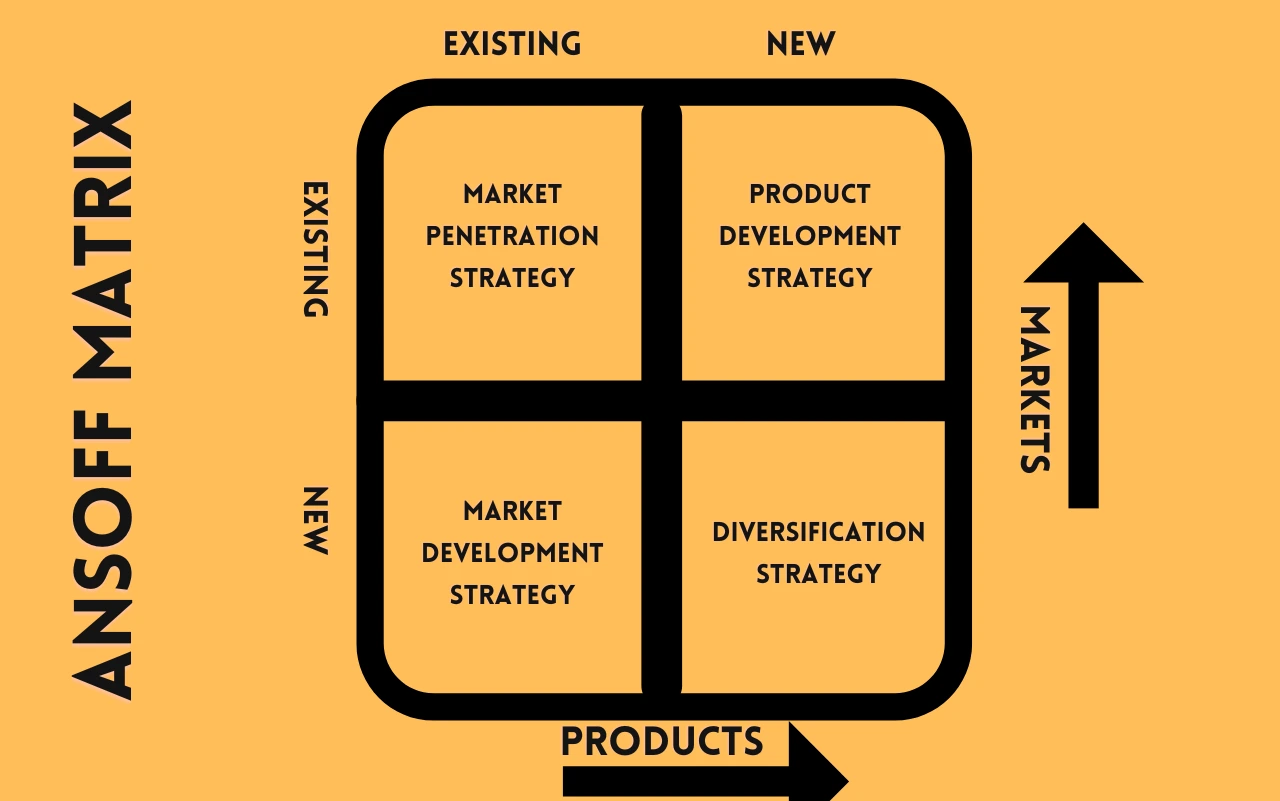
Market Penetration: Low-Risk Strategy
It is the most commonly used marketing strategy. It’s also known as the low-cost producer or the skimming strategy.
Market penetration is increasing a company’s market share through increasing sales of an already established product in that market (SOM).
Being an existing product in the existing market, the risk is relatively low in this quadrant. This eliminates any need for the corporation to test uncharted waters, making it the safer option. To expand your user base and boost customer satisfaction, try using innovative strategies for your current product in your current market. Reward programs, discounts, sales boosts, and mergers and acquisitions can help.
Product Development: Moderate Risk
The product development strategy is the most basic of all the strategies in this matrix. It is based on creating and launching a new product into an existing market. The product may be an enhancement or extension of an existing or new product.
This strategy is used when everything is the same in the marketing mix. The only thing that must be altered is the product’s price, which depends on your pricing power.
For this strategy to work, there must be a need for your product in the market; otherwise, it will fail miserably. You must also have enough resources to develop and launch a new product. Product development is relatively riskier than market penetration.
This product strategy matrix can also be used when you have developed a new technology that you want to test before commercializing it further to save money in developing something that does not meet customer needs.
Market Development: Moderate Risk
The market development matrix is a framework for segmenting markets into four categories:
- Newer Markets – These are markets that are emerging as a result of new technologies or changing lifestyles.
- Existing Markets – These are existing markets with growth opportunities for companies that offer innovative products and services.
- Declining Markets – These are mature markets where sales decline due to saturation or competition from lower-priced competitors.
- Innovative Growth Markets – These mature markets still have growth potential because they allow companies to introduce new products and services that appeal to younger customers.
The market development matrix allows you to define your strategic focus by identifying your business’s most promising market segments. With this strategy, you generally take your existing product into newer markets. Due to newer customers or markets, this quadrant is also riskier than market penetration.
Diversification: High Risk
This is the most precarious option available to you. Diversification entails peddling a novel ware to unsuspecting customers in different consumer niches. Since diversification necessitates actions in two of the four quadrants, it carries the highest risk.
Related diversification and unrelated diversification are the two main types of diversification.
Related Diversification — This option involves expanding beyond your current product or service line into something related but different from what you already do. For example, if you sell dog treats online, it might make sense to start selling cat treats too.
Unrelated Diversification — This is about going beyond your current product or service. For instance, if you sell dog treats online, maybe it makes sense for you to create a mobile app so customers can order directly from their phones while they’re on the go instead of having to check out on your website later on.
Product Market Matrix Example
Here are some generic examples of each strategy in the product market matrix:
Example #1 (Market Penetration)
A company has a great product that is selling well. It is also very profitable, but it’s only available in one city, and the company wants to expand its market share to other cities. In this case, the Company needs to focus on Market Penetration.
Example #2 (Product Development)
As an illustration, suppose a company launched a full-scale assault on the Asia Pacific market to peddle the company’s already wildly successful line of sportswear. While expanding marketing and distribution operations in a new country is always fraught with challenges, the fact that they are peddling a tried-and-true product makes the endeavor less difficult.
Example #3 (Market Development)
To illustrate, consider a cosmetics company whose hair care products are well-liked by women aged 28 to 35. They hope to profit from the brand’s existing customer base by investing extensively in developing a new line of hair care products, which will appeal to this demographic because of the brand’s success and loyalty within this group.
Example #4 (Diversification)
Let’s use the leather shoe manufacturer as an example of a successful diversified company. Investing heavily in consumer packaged goods, the management can diversify away from the extremely cyclical high-end shoe market.
Final Words
Simply put, the product market matrix is a framework that helps you evaluate your business idea and key products by considering two factors–the market(s) you’re targeting and the products you will sell.
User Story Mapping can be an effective way to track progress throughout the development process. It allows you to break down complicated projects into clear, small steps that are easier to manage at every stage.