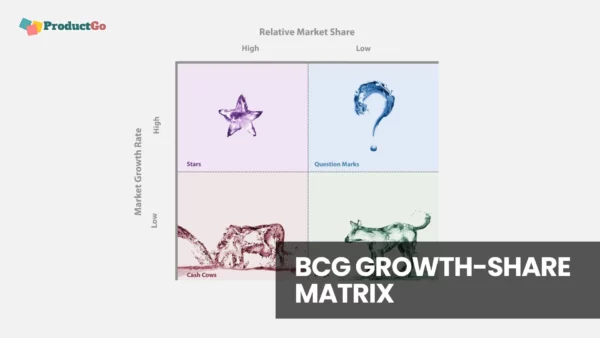
The BCG Growth-Share Matrix is a key tool for businesses to manage their product portfolios and make smart strategic decisions. Created by the Boston Consulting Group in the 1960s, this simple yet effective matrix helps companies understand their products’ market positions. It divides products into four groups – Stars, Cash Cows, Question Marks, and Dogs – based on their market growth and share.
This guide will explore each category, look at real-world examples, and show how combining the BCG Matrix with user story mapping can lead to even better business strategies.
The Fundamentals of the BCG Matrix
The BCG Matrix, also known as the Growth-Share Matrix, is a portfolio management tool developed by the Boston Consulting Group (BCG) in the 1960s. It is a four-quadrant matrix that classifies a company’s business units or products based on their market share and market growth rate.
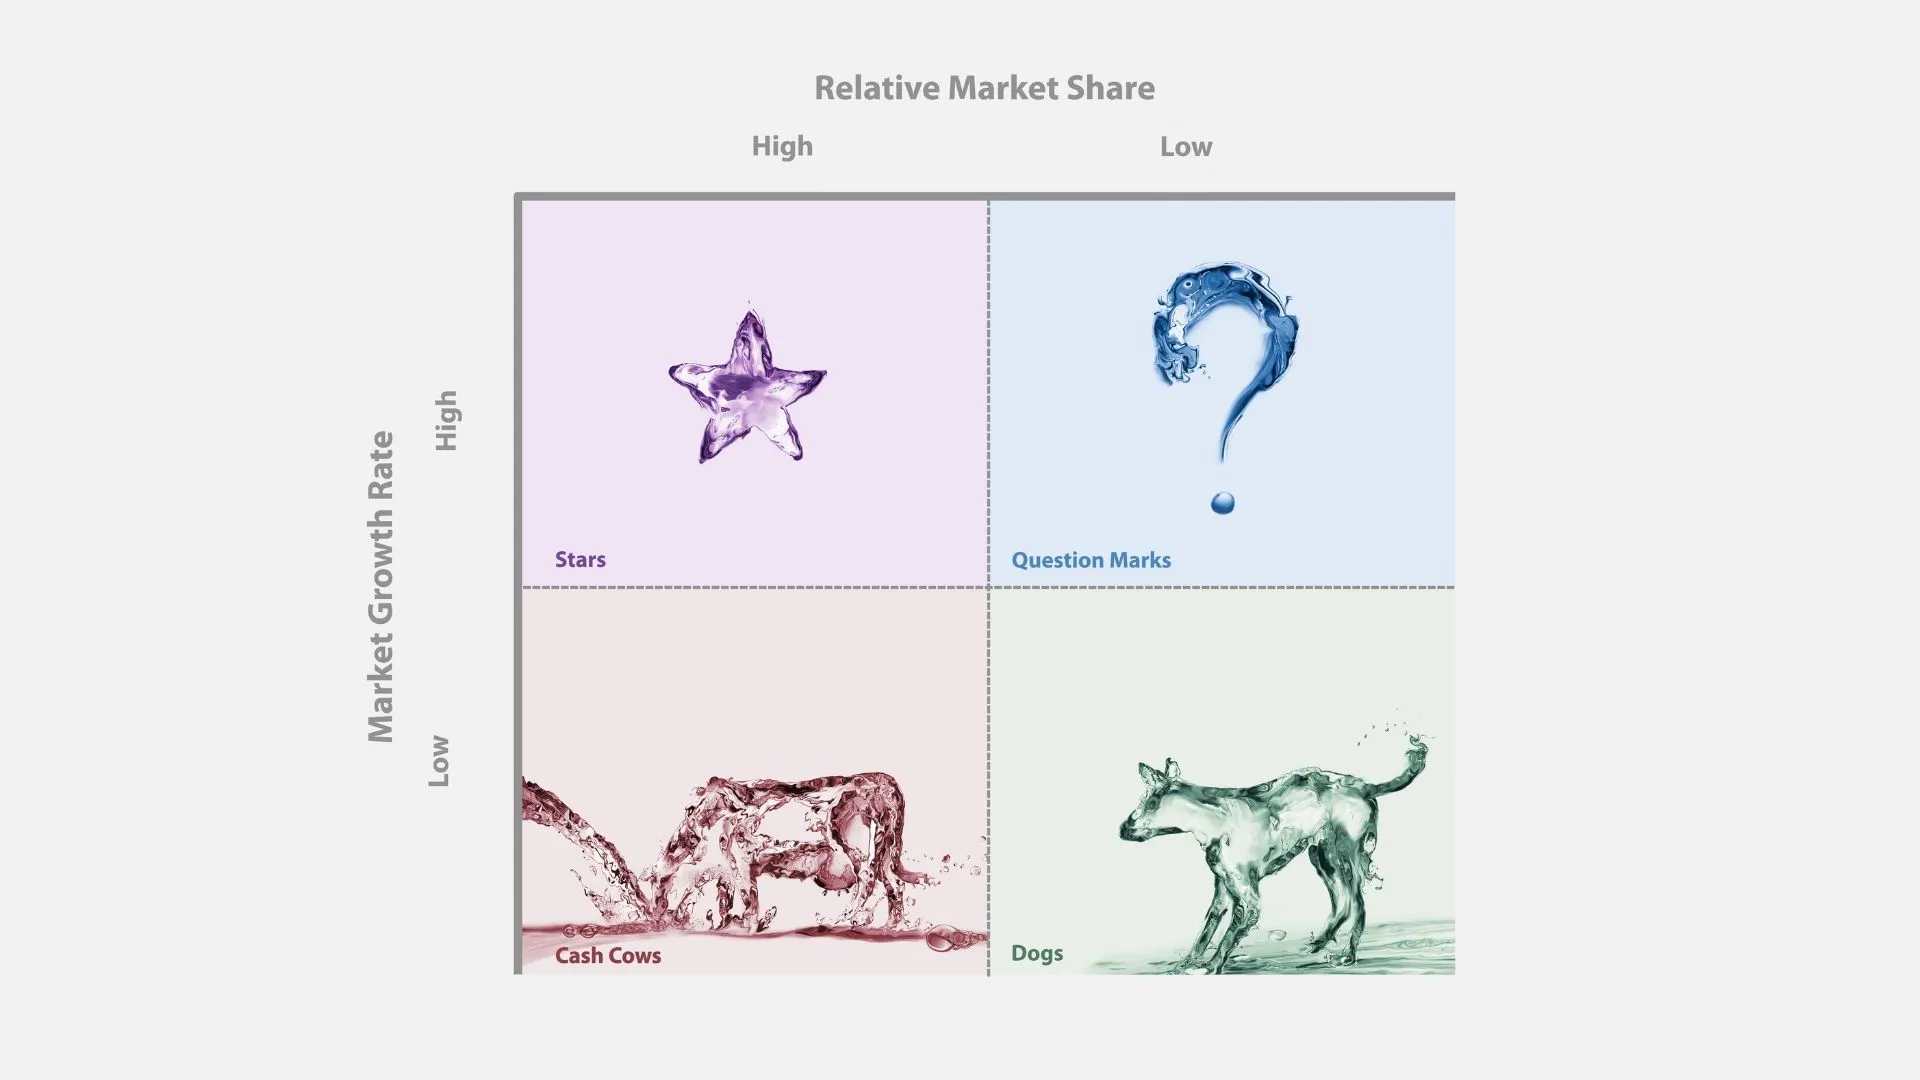
The four quadrants of the BCG Matrix are:
- Stars: Stars are high-growth, high-share businesses that generate high cash flow and require heavy investment to maintain their growth.
- Cash cows: Cash cows are low-growth, high-share businesses that generate substantial cash flow and require little investment to maintain their market position.
- Question marks: Question marks are low-share businesses in high-growth markets. They require significant investment to increase their market share, but there is no guarantee that they will succeed.
- Dogs: Dogs are low-growth, low-share businesses that generate little cash flow and require little investment. They may be considered for divestment or harvesting.
Understanding the BCG Matrix helps businesses allocate resources efficiently, fostering a balanced portfolio for sustained growth and profitability.
Related content: Product Market Matrix
Deep Dive into Each Quadrant
Stars (High Growth, High Market Share)
Stars are products or business units within a company that hold a large market share in a rapidly growing industry. They stand out for their high profitability potential and significant revenue generation. As market leaders, Stars often require substantial investment to sustain growth and fend off competition.
Strategically, Stars are pivotal for a company’s growth and expansion. They demand continuous investment to maintain their leading position and capitalize on market growth. Over time, as market growth stabilizes, Stars have the potential to evolve into Cash Cows, becoming stable sources of income with less need for intensive investment.
Cash Cows (Low Growth, High Market Share)
Cash Cows are characterized by their dominant position in a mature, low-growth market. They generate more cash than what is needed to maintain their market share. A classic example is Microsoft’s Windows operating system, which, despite the maturity of the PC market, continues to generate significant steady revenue for the company.

The key to managing Cash Cows lies in maximizing their profitability with minimal investment. Funds from these units should be strategically reallocated to nurture Stars or develop Question Marks. Cost efficiency, maintaining market dominance, and careful investment are crucial for sustaining the revenue stream from Cash Cows.
Question Marks (High Growth, Low Market Share)
Question Marks are business units in rapidly growing markets but with a small market share. They are unpredictable due to their unestablished position and the competitive nature of high-growth industries. For instance, a new tech startup in the burgeoning field of artificial intelligence could be considered a Question Mark.
Deciding on investment or divestment in Question Marks involves careful analysis of market trends and the unit’s potential to gain market share. Balancing risk and potential reward is crucial in handling Question Marks effectively.
Dogs (Low Growth, Low Market Share)
Dogs are business units that occupy a small share in a stagnant or declining market. Their main challenges include low profitability, limited growth prospects, and often consuming more resources than they generate. These units struggle to achieve a significant market presence due to intense competition or market saturation.
The primary strategy for Dogs is to consider divestiture or liquidation, thereby freeing up resources for more profitable ventures. If outright divestment isn’t immediately viable, minimizing further investment and cutting costs can be a temporary measure.
Applying the BCG Matrix in Business Planning
Step-by-Step Guide on Using the Matrix for Your Business
- Data Gathering: Collect detailed market share and growth rate data for each business unit or product line.
- Matrix Construction: Plot each unit on the matrix based on its market growth rate and relative market share.
- Analysis of Quadrants: Assess the distribution of your business units across the Stars, Cash Cows, Question Marks, and Dogs categories.
- Resource Allocation: Decide how to allocate resources. For example, invest more in Stars and support Cash Cows for consistent revenue.
- Strategic Planning: Develop specific strategies for each category – growth strategies for Stars and Question Marks, maintenance for Cash Cows, and divestment for Dogs.

Case studies of successful implementation:
Many companies have successfully used the BCG Matrix to improve their business performance. Here are a few examples:
- Coca-Cola: Coca-Cola used the BCG Matrix to develop a global marketing strategy for its flagship Coca-Cola brand. The company identified Stars in developed markets and Question Marks in emerging markets, and it developed targeted marketing campaigns for each quadrant.
- Procter & Gamble: P&G used the BCG Matrix to manage its portfolio of brands. The company identified and invested in Stars, maintained Cash Cows, and divested Dogs. This strategy helped P&G to maintain its competitive advantage and grow its business.
Common Pitfalls and How to Avoid Them
- Over-Simplification: The matrix is a simplification tool. Avoid making critical decisions based solely on this model without considering market nuances and other strategic tools.
- Static Analysis: Markets are dynamic. Regularly update the matrix to reflect current market conditions.
- Ignoring External Factors: Be aware of changing market trends, technological advancements, and competitive dynamics that might impact your analysis.
- Balance: Ensure not to neglect any quadrant. Each plays a vital role in the overall health of the portfolio.
Beyond the Quadrants – Integrating Other Business Tools
The BCG Matrix is a valuable tool for portfolio analysis, but its effectiveness is significantly enhanced when used in conjunction with other strategic frameworks. This integrative approach provides a more comprehensive view of a company’s strategic position.

Synergizing the BCG Matrix with Other Strategic Tools
Combining with SWOT Analysis:
- Strengths and Weaknesses: The internal factors of SWOT can help understand why certain business units are Stars, Cash Cows, Question Marks, or Dogs.
- Opportunities and Threats: The external factors from a SWOT analysis can provide insights into market dynamics that may affect the future positioning of business units within the BCG Matrix.
- Strategic Alignment: Use SWOT to identify how to leverage strengths and opportunities or mitigate weaknesses and threats in each quadrant of the BCG Matrix.
Porter’s Five Forces and the BCG Matrix:
- Industry Competition: Assess how the intensity of competitive rivalry affects the position of a business unit in the BCG matrix.
- Potential Entrants and Substitute Products: Understanding these forces can inform the likelihood of a Star remaining dominant or a Question Mark gaining market share.
- Supplier and Buyer Power: Analyze how these dynamics might shift a business unit’s market share, potentially repositioning it within the matrix.
Adapting the BCG Matrix in the Context of Digital Transformation and New Market Trends
Impact of Digital Transformation:
- Re-evaluating Market Share and Growth: Digital transformation can rapidly alter market landscapes, requiring a reevaluation of what constitutes high market share and growth.
- Identifying New Opportunities: Use the matrix to identify where digital innovation could transform Question Marks into Stars or revitalize Cash Cows.
Keeping Pace with Market Trends:
- Continuous Monitoring: Regularly update the matrix to reflect changes like emerging technologies, shifts in consumer behavior, or new regulatory environments.
- Flexibility in Strategy: Be prepared to pivot strategies for different business units as new trends emerge, keeping the portfolio aligned with market realities.
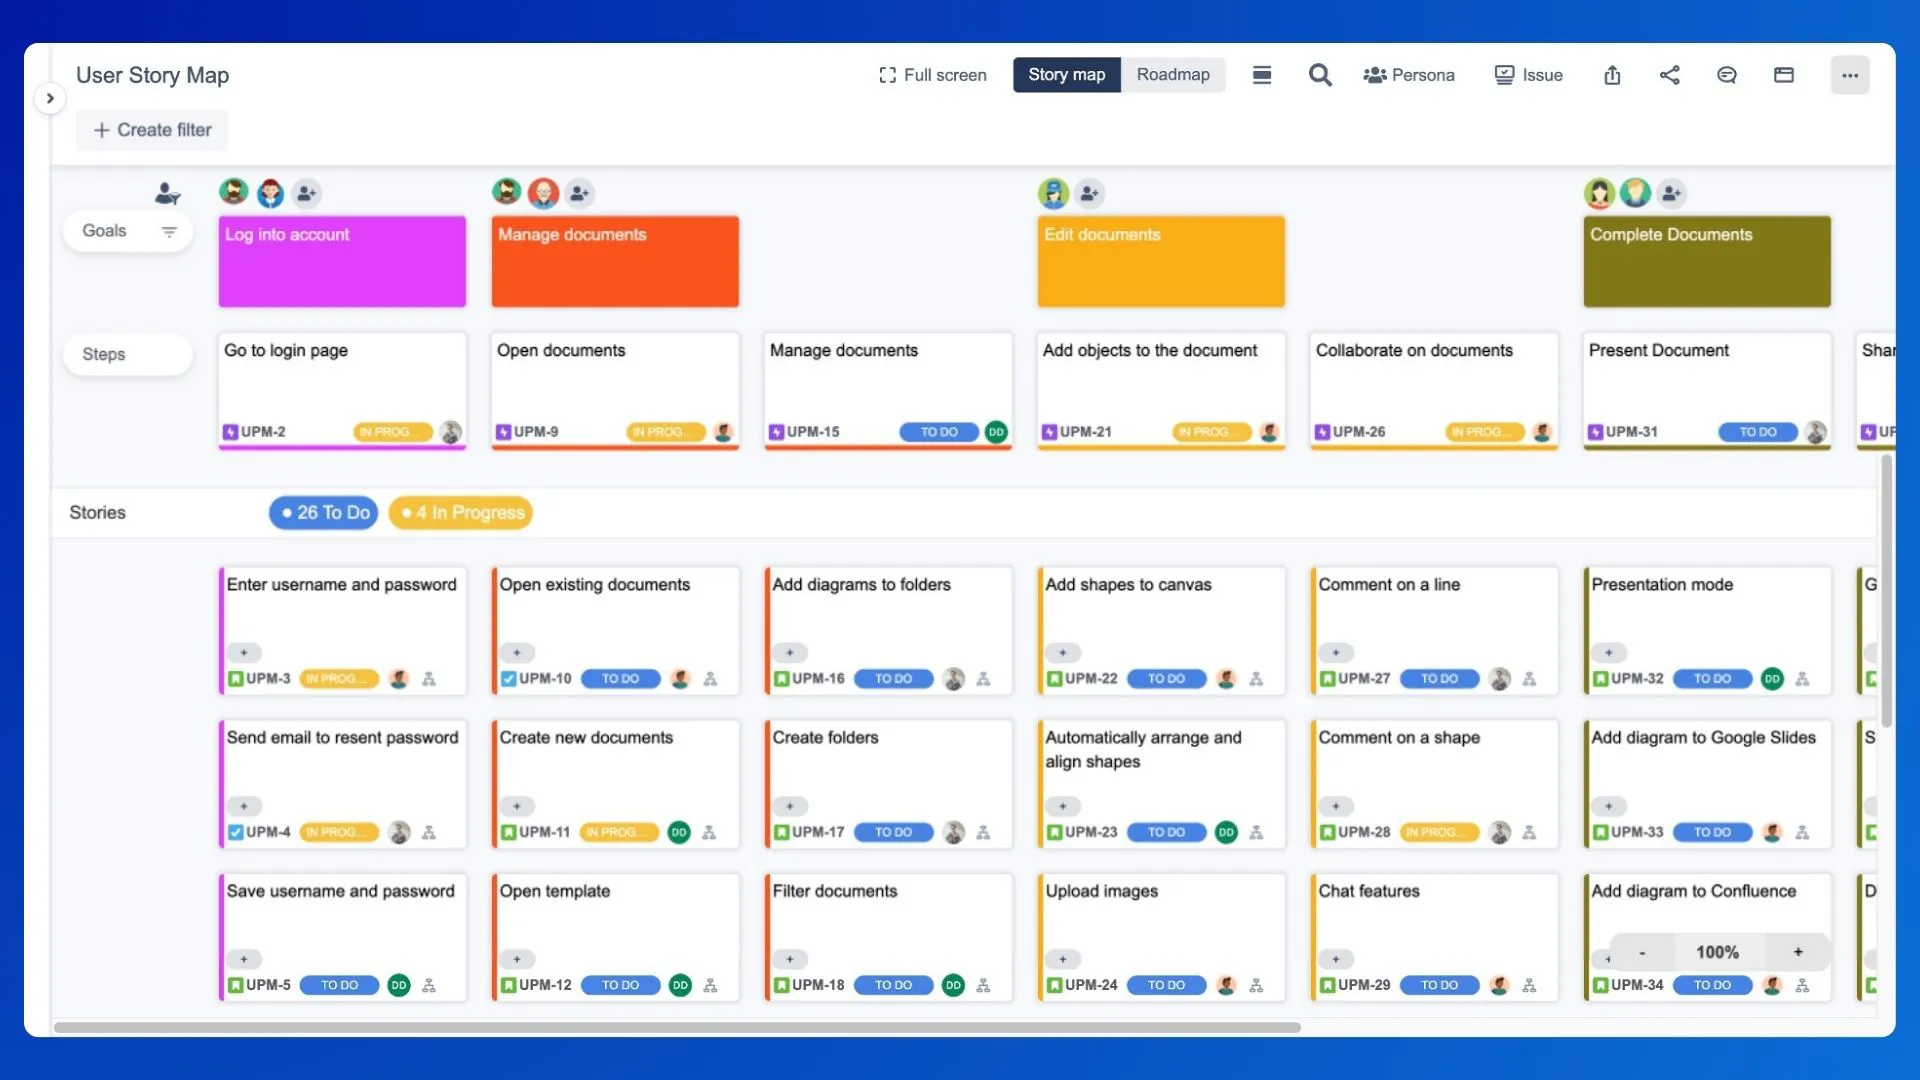
How user story map helps with BCG matrix
User story mapping is a way to visualize and prioritize user needs and deliver value iteratively. It can help with the BCG matrix, which is a tool to evaluate the strategic position of a firm’s brand portfolio. Here are some ways how:
- For question marks, user story mapping can help find the most important features and user goals that can increase the market share and growth potential.
- For stars, user story mapping can help maintain and improve the competitive advantage and customer satisfaction.
- For cash cows, user story mapping can help optimize and streamline the product development and maintenance process.
- For dogs, user story mapping can help decide whether to invest, divest, or discontinue the product.
Try out the user story map by ProductGo now to enhance your Growth-share matrix uses.
Conclusion
The BCG Matrix is a classic yet powerful tool for businesses to analyze and plan their product strategies. By classifying products as Stars, Cash Cows, Question Marks, or Dogs, companies can decide where to invest, develop, or cut back. Adding user story mapping into the mix makes this approach even more effective, keeping the focus on customer needs and market trends.
To get the most out of these strategies and stay ahead in the market, try combining the BCG Matrix with user story mapping techniques. Explore more about this approach at ProductGo’s user story map, and discover new ways to boost your business planning.